Tutorial: Loading CSV Files to a Postgres Database
This tutorial explains how to load data stored in multiple CSV files to a Postgres Database and then use Custom Transforms and Models to combine them together and analyze the results.
We are going to use the CSV Extractor to extract the data from the CSV files and the Postgres Loader to load the extracted data to Postgres.
Prerequisites
In contrast to loading data from an API, the attributes (schema) of the data included in a CSV file differ for each CSV file loaded.
That means that Meltano can not include pre-bundled Transforms and Models for data loaded from CSV files. To make the most of your data and be able to run analyses, you have to add custom Transforms and Models.
You can check how Transforms and Models work in Meltano and the Tutorial on how to add Custom Transforms and Models if you want more information on those topics.
Motivation and Running example
As a running example, we'll use GitFlix, a fictional git based video streaming service.
We have all our data for GitFlix in CSV files: We export our user data from our CRM, the episode information from our CMS and the streaming data from our own custom streaming system.
It's time for us to move all our data to a Postgres Database, so that we can have everything together, run some advanced analysis and compare the results.
We have a pretty simple scenario: Users stream episodes from various TV series.
For each user we have their name, age, their lifetime value to GitFlix (total subscriptions until today) and some additional data on how often they login to GitFlix and their total logins since they subscribed.
 id |  name  | age | gender |  clv  | avg_logins | logins
----+--------+-----+--------+-------+------------+--------
  1 | John   |  23 | male   | 163.7 |  0.560009  | 123
  2 | George |  42 | male   | 287.3 |  1.232155  | 147
  3 | Mary   |  19 | female | 150.3 |  #DIV/0!   | 0
  4 | Kate   |  52 | female | 190.1 |  0.854654  | 156
  5 | Bill   |  35 | male   | 350.8 |  1.787454  | 205
  6 | Fiona  |  63 | female | 278.5 |  #DIV/0!   | 0
For episodes, we store their number (e.g. '304' for episode 4 of season 3), title, the TV series they belong to (e.g. 'Star Trek TNG'), the rating the episode got in IMDb and the expected ad revenue per minute on ad supported plans (the streaming wars have forced GitFlix to offer both a paid and an ad supported free subscription).
 id | no  |        title        |  tv_series   | rating | ad_rev
----+-----+---------------------+--------------+--------+-----------
  1 | 101 | Pilot               | Breaking Bad |    8.9 | $2,438.13
  2 | 102 | Cat in the Bag...   | Breaking Bad |    8.7 | $1,718.42
  3 | 202 | Grilled             | Breaking Bad |    9.2 | $1,946.21
  4 | 101 | The National Anthem | Black Mirror |    7.9 | $1,198.24
  5 | 406 | Black Museum        | Black Mirror |    8.7 | $1,256.89
  6 | 104 | Old Cases           | The Wire     |    8.3 | $834.67
  7 | 306 | Homecoming          | The Wire     |    8.9 | $764.37
Finally, for each episode streamed by each user, we keep track of how many minutes the user has streamed each day (not all users view the full length of all episodes at one sitting).
 id | user_id | episode_id | minutes | day | month | year
----+---------+------------+---------+-----+-------+------
  1 |       1 |          1 |      40 |  10 |     1 | 2019
  2 |       1 |          2 |      42 |  10 |     1 | 2019
  3 |       1 |          3 |      38 |  11 |     1 | 2019
  4 |       1 |          4 |      12 |  11 |     1 | 2019
  5 |       1 |          5 |      27 |  11 |     1 | 2019
  6 |       2 |          2 |      36 |  11 |     1 | 2019
  7 |       2 |          6 |      45 |  11 |     1 | 2019
  8 |       2 |          7 |      44 |  11 |     1 | 2019
  9 |       3 |          4 |      40 |  10 |     1 | 2019
 10 |       3 |          5 |      41 |  11 |     1 | 2019
 11 |       3 |          1 |      11 |  11 |     1 | 2019
 12 |       4 |          3 |      22 |  10 |     1 | 2019
 13 |       4 |          3 |      18 |  11 |     1 | 2019
 14 |       4 |          6 |      40 |  11 |     1 | 2019
 15 |       5 |          2 |      34 |  11 |     1 | 2019
 16 |       5 |          4 |      41 |  11 |     1 | 2019
 17 |       5 |          5 |      39 |  12 |     1 | 2019
 18 |       5 |          6 |      36 |  12 |     1 | 2019
 19 |       6 |          1 |      19 |  11 |     1 | 2019
 20 |       6 |          3 |      35 |  11 |     1 | 2019
 21 |       6 |          7 |      48 |  11 |     1 | 2019
 22 |       6 |          1 |      24 |  12 |     1 | 2019
We'll use Meltano to:
- Load the data to our Postgres database.
- Use custom transforms to clean and normalize the data.
- Create a custom Meltano Model to explore the transformed data and generate meaningful reports.
Initialize Your Project
For this tutorial, you can use a new or existing Meltano project. Throughout the rest of this tutorial, we'll assume that your Meltano project is called csv-project.
If you need help getting started, we recommend reviewing the Installation documentation and Getting Started Guide to set up your first project.
To speed up the process, download the example CSV files to the extract/ directory of your Meltano project (e.g. csv-project/extract/):
Note on CSV files
Each input CSV file used with the CSV Extractor must be a traditionally-delimited CSV (comma separated columns, newlines indicate new rows, double quoted values).
The first row is the header defining the attribute name for that column and will result to a column of the same name in the database. It must have a valid format with no spaces or special characters (like for example ! or @, etc).
You can check the downloaded files as an example of valid CSV files (they were generated by exporting Google Sheets to CSV).
We'll also need to download the following definition file in the same directory:
[
  { "entity": "users", "file": "extract/GitFlixUsers.csv", "keys": ["id"] },
  { "entity": "episodes", "file": "extract/GitFlixEpisodes.csv", "keys": ["id"] },
  { "entity": "streams", "file": "extract/GitFlixStreams.csv", "keys": ["id"] }
]
This file allows us to define the CSV files that the CSV Extractor is going to extract data from. The available options are as follows:
- entity: The entity name, used as the table name for the data loaded from that CSV.
- file: Local path (relative to the project's root) of the file to be loaded.
- keys: The names of the columns that constitute the unique keys for that entity.
Configure the Extractor
Open your Meltano instance and click "Pipelines" in the top navigation bar. You should now see the Extractors page, which contains various options for connecting your data source.
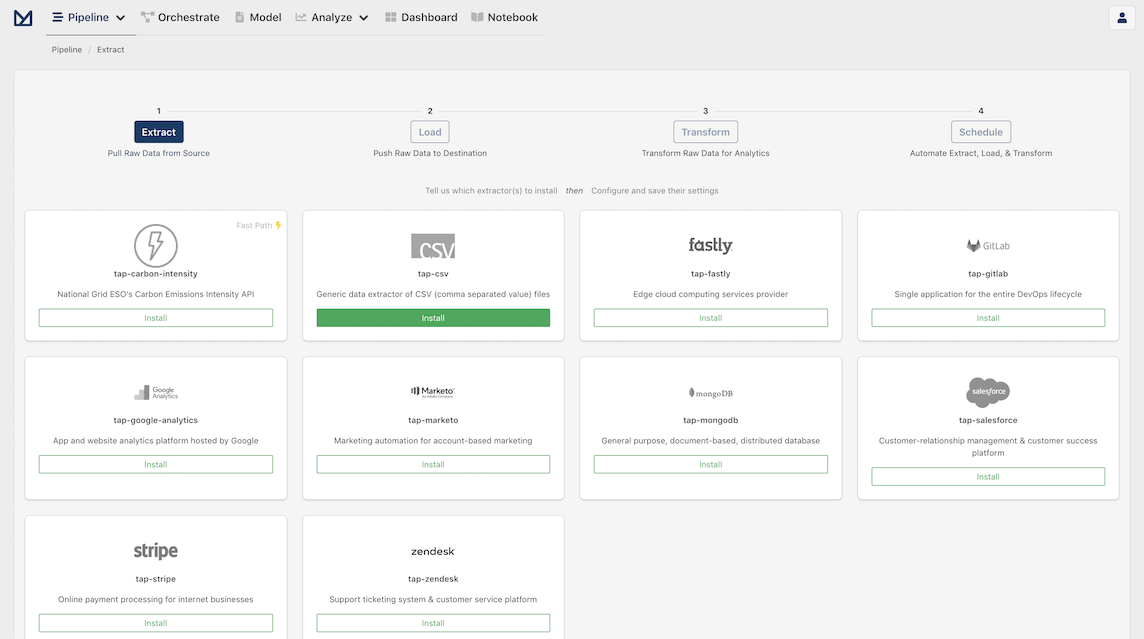
Let's install tap-csv by clicking on the Install button inside its card.
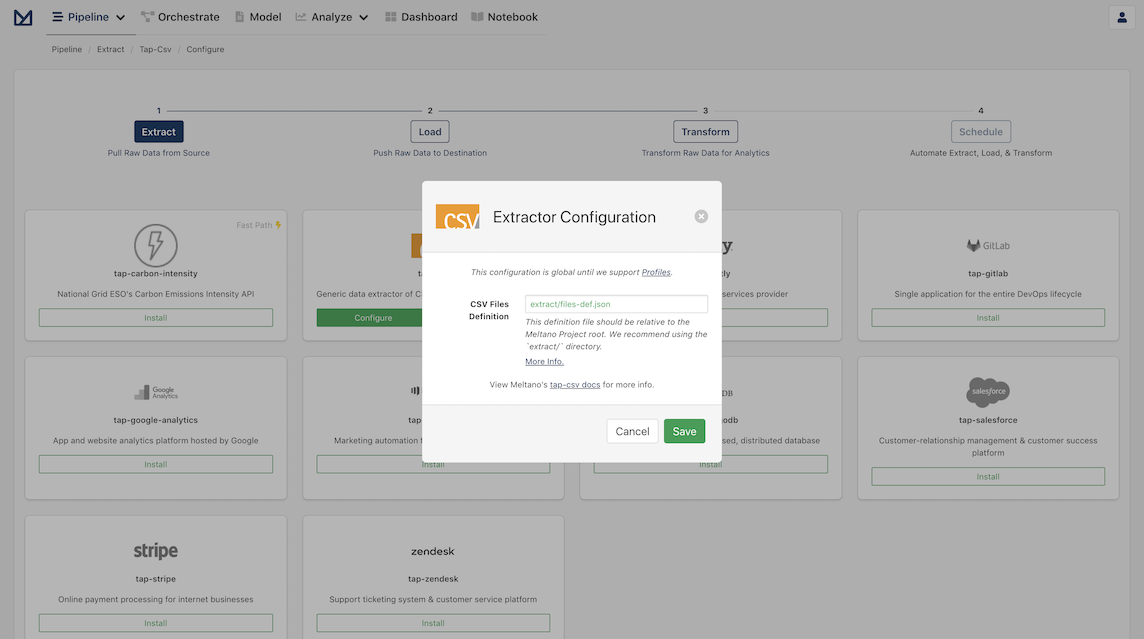
On the configuration modal leave the default value for the CSV files definition location (extract/files-def.json) and click Save to finish configuring the extractor and progress to the next step.
Setup the Postgres Loader
Once your Extractor configuration is finished, you should be greeted with the Loaders page. Click to Install Postgres and set the credentials for your local Postgres.
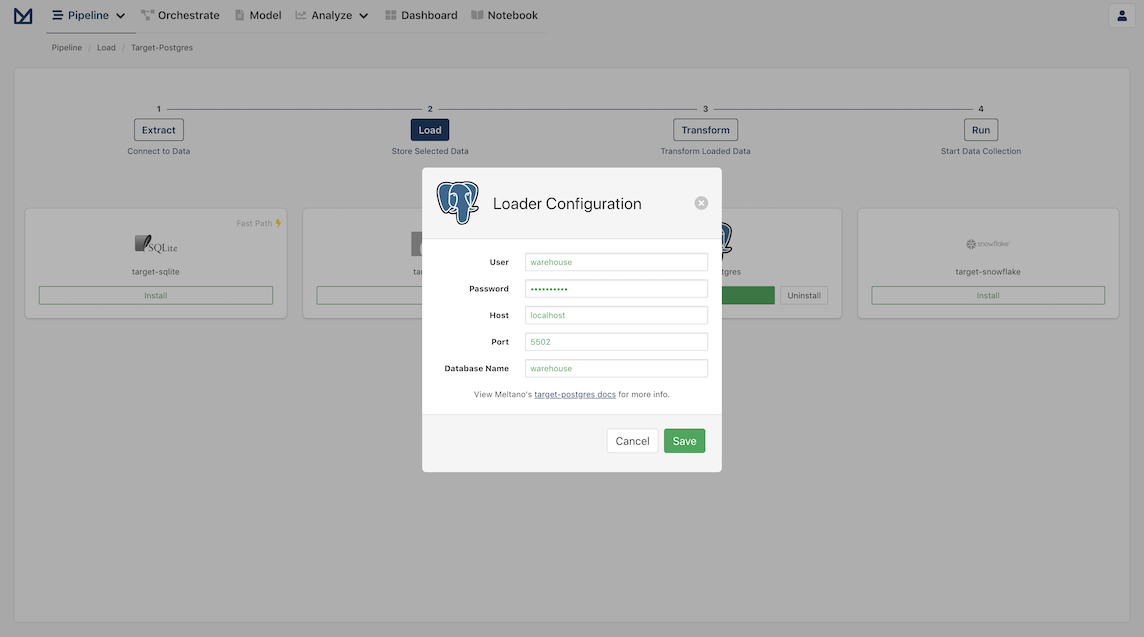
Information on how to install a Postgres Database on your local machine and configure the Postgres Loader can be found on PostgresQL Database Tutorials.
Apply transformations as desired
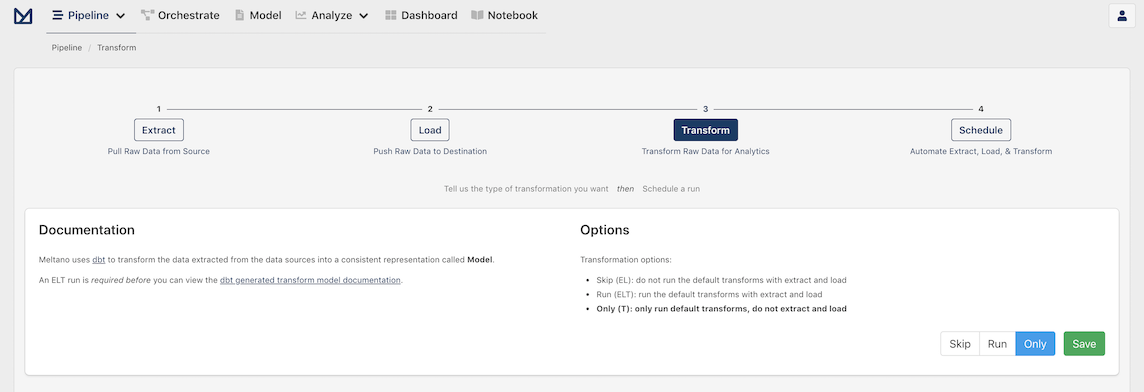
With our extractor and loader configured, you should now see the following page:
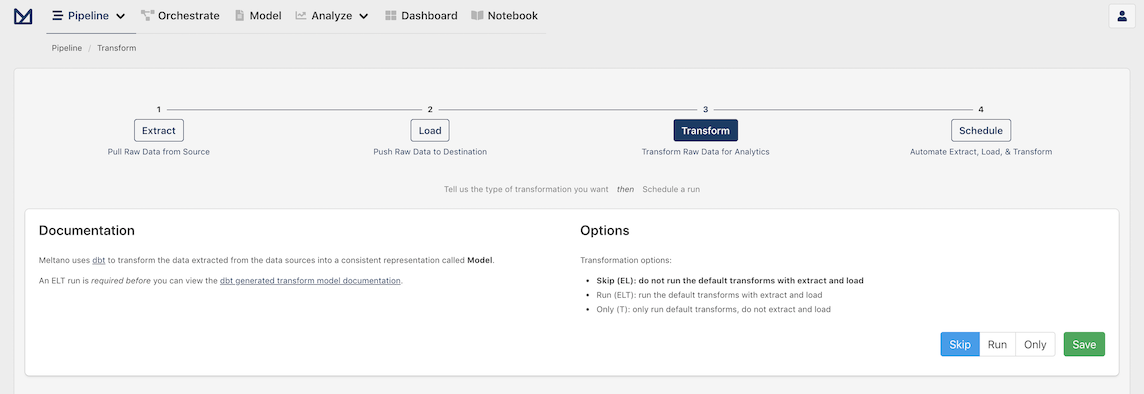
This page allows you to apply transformations to your data. There are no default transforms that come pre-bundled with Meltano for data fetched using the CSV Extractor, so we are going to select Skip and then click Save.
Create a pipeline schedule
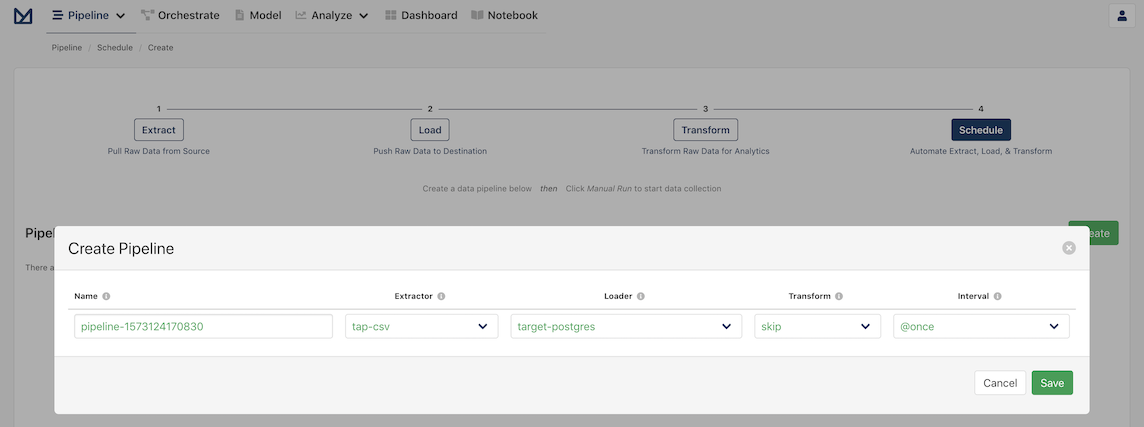
You should now be greeted with the Schedules page with a modal to create your first pipeline!
Meltano provides Orchestration using Apache Airflow, which allows you to create scheduled tasks to run pipelines automatically. For example, you may want a recurring task that updates the database at the end of every business day.
In the current form, you will see:
- A pipeline name which has a default name that is dynamically generated, but can be easily changed if desired
- The extractor the pipeline will use, which should be
tap-csv - The loader the pipeline will use, which should be
target-postgres - Whether the transform step should be applied, which should be
skip - The interval at which the pipeline should be run, which is set by default to be
@once
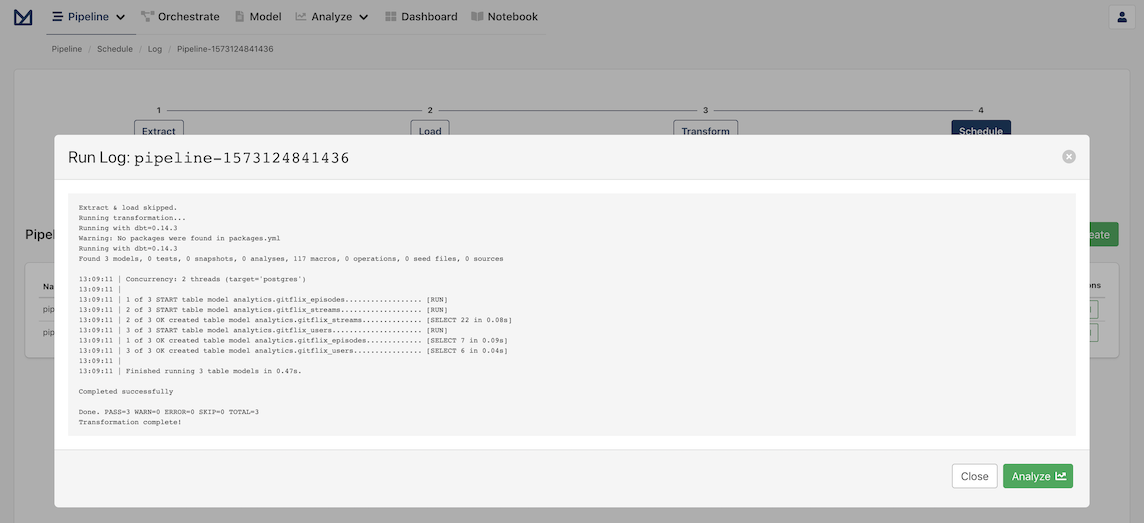
All we need to do is click Save to start our new pipeline! The pipeline's log opens automatically and you can check the pipeline running and what Meltano does behind the scenes to extract and load the data.
You should see a spinning icon that indicates that the pipeline is not completed. Once it's complete, the indicator will disappear and you should be able to see the final results of the extraction:
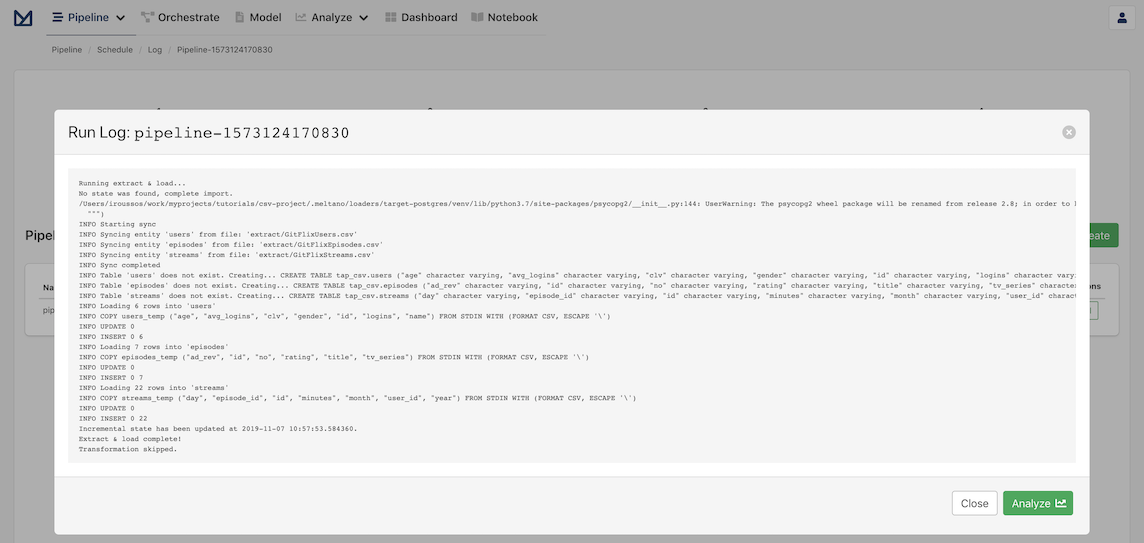
The extracted data will be available in the tap_csv schema in your Postgres database.
Using our running example, tables users, episodes and streams will be available in the tap_csv schema, with all the data from the original CSV files loaded as records.
Motivation for transforming the raw extracted data
All the records in our CSV files were loaded successfully to our Database, but we are still having some issues:
- Everything is a string in a CSV, so all values were loaded as
character varyingto our Postgres DB. Strings are not very useful for calculating aggregates, so we want to convert all numerical measures to floats or integers accordingly. - Similarly, we want to run more complex value transformations; for example, convert a value like
$2,638,765.21to2638765.21by removing the$and commas and converting the result to a float. - Column names like
clv(short for customer lifetime value),avg_logins(short for average logins per day) orad_rev(short for expected ad revenue per minute on ad supported plans) can be part of raw formatting but are not very useful to a high level user. We want to provide proper, descriptive, attribute names. - Some of our columns have errors like
#DIV/0!(division by zero), which we want to clean and convert to NULL values or 0s (depending on the business logic).
We are going to add some simple custom transforms and run them to clean and normalize the data.
Add Custom Transforms
Let's start by adding the base transforms that will clean the loaded data and fix the issues described in the previous section.
TIP
You can download all the files in this and the following Sections by clicking the name of the file above its contents.
You should select to download the file in the directory indicated before its name.
For example, transform/dbt_project.yml should be downloaded to the csv-project/transform/ directory if your project is called csv-project
First step is to enable the option to run Custom Transforms for our project and set the results of the transforms to be stored as materialized tables:
... ... ...
models:
    my_meltano_project:
        materialized: table
... ... ...
The Transforms must be added as dbt models (.sql files) under the csv-project/transform/models/my_meltano_project/ directory or any of its subdirectories.
The name of each Transform's file will be the name of the final table in the analytics schema, so we choose to name them:
gitflix_users.sqlgitflix_episodes.sqlgitflix_streams.sql
transform/models/my_meltano_project/gitflix_users.sql
with source as (

    select * from {{ env_var('MELTANO_LOAD_SCHEMA') }}.users

),

renamed as (

    select
        -- Primary Key: Cast to integer and provide unique name
        CAST(id as integer)                 as user_id,

        -- Profile Attributes
        name                                as name,

        -- Fix empty values and cast the age to integer
        CAST(nullif(age, '') as integer)    as age,

        -- Add an age_group categorical dimension
        case
            when CAST(nullif(age, '') as integer) < 18
                then '1 - Under 18'
            when CAST(nullif(age, '') as integer) >= 18
              and CAST(nullif(age, '') as integer) < 40
                then '2 - 20 to 40'
            when CAST(nullif(age, '') as integer) >= 40
              and CAST(nullif(age, '') as integer) < 60
                then '3 - 40 to 60'
            when CAST(nullif(age, '') as integer) >= 60
                then '4 - Above 60'
            else '5 - Unknown'
        end                                 as age_group,

        gender                              as gender,

        -- Fix empty values and cast the rating to float
        CAST(nullif(clv, '') as float)      as customer_lifetime_value,

        -- Remove #DIV/0 errors, keep only 2 decimals and convert to numeric
        case
            when avg_logins is NULL
                then NULL
            when avg_logins like '%#DIV/0%'
                then NULL
            else
                round(
                   CAST(nullif( avg_logins , '') as numeric),
                   2
                )
        end as avg_logins_per_day,

        CAST(nullif(logins, '') as integer) as logins

    from source

    where
      -- Make sure that we keep only users with valid IDs
      id is NOT NULL

      -- and that we remove all the test entries
      and name NOT LIKE 'test_user_%'

)

select * from renamed
transform/models/my_meltano_project/gitflix_episodes.sql
with source as (

    select * from {{ env_var('MELTANO_LOAD_SCHEMA') }}.episodes

),

renamed as (

    select
        -- Primary Key: Cast to integer and provide unique name
        CAST(id as integer) as episode_id,

        -- Keep the Episode Number as a string
        no as episode_number,
        title as title,
        tv_series as tv_series,

         -- Fix empty values and cast the rating to float
        CAST(nullif(rating, '') as float) as imdb_rating,

        -- Remove the $ from the start and the commas
        --  and then cast to float
        CAST(
            nullif( replace( substring(ad_rev from 2), ',', ''),'' )
            AS float
        ) as ad_revenue_per_minute

    from source

    where
      -- Make sure that we keep only episodes with valid IDs
      id is NOT NULL

      -- and that we remove all the test entries
      and title NOT LIKE 'test_the_test_%'

)

select * from renamed
transform/models/my_meltano_project/gitflix_streams.sql
with source as (

    select * from {{ env_var('MELTANO_LOAD_SCHEMA') }}.streams

),

renamed as (

    select
        -- Primary Key: Cast to integer and provide unique name
        CAST(id as integer) as stream_id,

        -- Foreign Keys: Cast to integer
        CAST(user_id as integer) as user_id,
        CAST(episode_id as integer) as episode_id,

        -- Cast everything else to integer
        CAST(nullif(minutes, '') as integer) as minutes_streamed,

        CAST(nullif(day, '') as integer) as day,
        CAST(nullif(month, '') as integer) as month,
        CAST(nullif(year, '') as integer) as year

    from source

    where
      -- Make sure that we keep only streams with valid IDs
      id is NOT NULL
      and user_id is NOT NULL
      and episode_id is NOT NULL

)

select * from renamed
TIP
In the transforms above we could have hard coded the schema the raw tables reside inside (in this example tap_csv), but we make use of the fact that it is defined by the environmental variable MELTANO_LOAD_SCHEMA and use that instead.
That means that even if you change the configuration and load the data to a different schema, the Transforms will not have to change.
Run the Custom Transforms
We are now ready to run the custom transforms!
Go back to your Meltano instance, select "Pipelines" in the top navigation bar and click the "Transform" option. You should now see the Transform page.
We have already loaded the data, so we want to run only the transforms that we just added: we are going to select Only and then click Save.
You'll be presented with a new pipeline ready to run, with the Transform step set to Only.
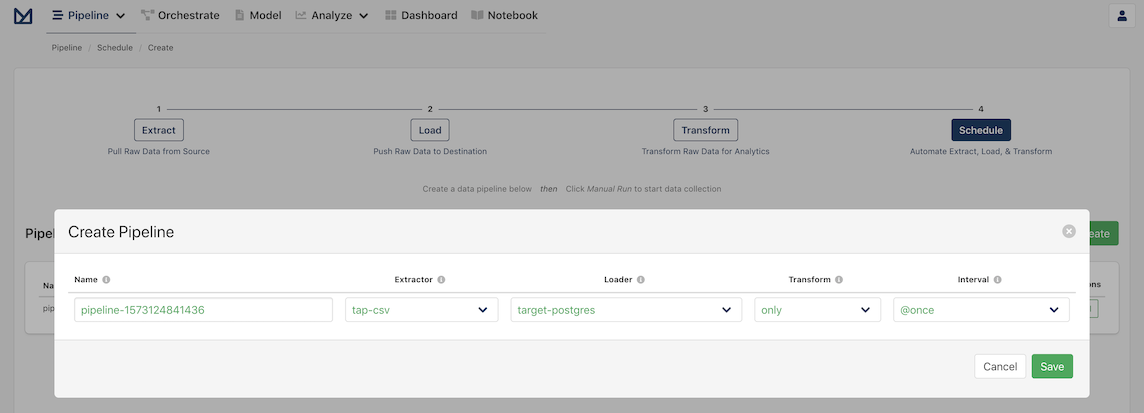
Meltano remembers the configuration for the Extractor and Loader, so there is nothing else required on our part; we can click Save and wait for the transform to run successfully:
The result will be three new tables in the analytics schema of your Postgres database. They have the transformed schema and data, following the transforms defined in the previous section:
analytics.gitflix_usersanalytics.gitflix_episodesanalytics.gitflix_streams
Add Custom Meltano Models
The final step is to make our transformed data available in Meltano Analyze as Models.
We have to add 2 types of files:
- Three table.m5o files, which define the available columns and aggregates for each table created during the Transform step.
- A topic.m5o file, which represents the connections between tables, i.e. what they can be joined on.
These files must be added under the csv-project/model/ directory.
{
  version = 1
  sql_table_name = gitflix_users
  name = gitflix_users
  columns {
    user_id {
      primary_key = true
      hidden = true
      type = string
      sql = "{{table}}.user_id"
    }
    name {
      label = User Name
      description = User Name
      type = string
      sql = "{{table}}.name"
    }
    gender {
      label = User Gender
      description = User Gender
      type = string
      sql = "{{table}}.gender"
    }
    age_group {
      label = User Age Group
      description = User Age Group
      type = string
      sql = "{{table}}.age_group"
    }
  }
  aggregates {
    total_users {
      label = Total Users
      description = Total Users
      type = count
      sql = "{{table}}.user_id"
    }
    average_age {
      label = Average User Age
      description = Average User Age
      type = avg
      sql = "{{table}}.age"
    }
    total_customer_lifetime_value {
      label = Total Customer Lifetime Value
      description = Total Customer Lifetime Value
      type = sum
      sql = "{{table}}.customer_lifetime_value"
    }
    average_customer_lifetime_value {
      label = Average Customer Lifetime Value
      description = Average Customer Lifetime Value
      type = avg
      sql = "{{table}}.customer_lifetime_value"
    }
    average_logins_per_day {
      label = Average User Logins Per Day
      description = Average User Logins Per Day
      type = avg
      sql = "{{table}}.avg_logins_per_day"
    }
    total_logins {
      label = Total User Logins
      description = Total User Logins
      type = sum
      sql = "{{table}}.logins"
    }
    average_logins {
      label = Average User Logins
      description = Average User Logins
      type = avg
      sql = "{{table}}.logins"
    }
  }
}
model/gitflix_episodes.table.m5o
{
  version = 1
  sql_table_name = gitflix_episodes
  name = gitflix_episodes
  columns {
    episode_id {
      primary_key = true
      hidden = true
      type = string
      sql = "{{table}}.episode_id"
    }
    tv_series {
      label = TV Series
      description = TV Series
      type = string
      sql = "{{table}}.tv_series"
    }
    title {
      label = Episode Title
      description = Episode Title
      type = string
      sql = "{{table}}.title"
    }
    episode_number {
      label = Episode Number
      description = Episode Number
      type = string
      sql = "{{table}}.episode_number"
    }
  }
  aggregates {
    total_episodes {
      label = Total Episodes
      description = Total Episodes
      type = count
      sql = "{{table}}.episode_id"
    }
    average_imdb_rating {
      label = Average IMDB Rating
      description = Average IMDB Rating
      type = avg
      sql = "{{table}}.imdb_rating"
    }
    total_ad_revenue_per_minute {
      label = Total Ad Revenue per Minute
      description = Total Ad Revenue per Minute
      type = sum
      sql = "{{table}}.ad_revenue_per_minute"
    }
    average_ad_revenue_per_minute {
      label = Average Ad Revenue per Minute
      description = Average Ad Revenue per Minute
      type = avg
      sql = "{{table}}.ad_revenue_per_minute"
    }
  }
}
model/gitflix_streams.table.m5o
{
  version = 1
  sql_table_name = gitflix_streams
  name = gitflix_streams
  columns {
    stream_id {
      primary_key = true
      hidden = true
      type = string
      sql = "{{table}}.stream_id"
    }
    user_id {
      label = User ID
      hidden = yes
      type = string
      sql = "{{TABLE}}.user_id"
    }
    episode_id {
      label = Episode ID
      hidden = yes
      type = string
      sql = "{{TABLE}}.episode_id"
    }
    day {
      label = Stream Day
      description = Stream Day
      type = string
      sql = "{{table}}.day"
    }
    month {
      label = Stream Month
      description = Stream Month
      type = string
      sql = "{{table}}.month"
    }
    year {
      label = Stream Year
      description = Stream Year
      type = string
      sql = "{{table}}.year"
    }
  }
  aggregates {
    total_streams {
      label = Total Streams
      description = Total Streams
      type = count
      sql = "{{table}}.stream_id"
    }
    total_minutes_streamed {
      label = Total Minutes Streamed
      description = Total Minutes Streamed
      type = sum
      sql = "{{table}}.minutes_streamed"
    }
    average_minutes_streamed {
      label = Average Minutes Streamed
      description = Average Minutes Streamed
      type = avg
      sql = "{{table}}.minutes_streamed"
    }
  }
}
{
  version = 1
  name = gitflix
  connection = postgres_db
  label = GitFlix
  designs {
    gitflix_users {
      label = GitFlix Users
      from = gitflix_users
      description = "Info on GitFlix Users"
    }
    gitflix_episodes {
      label = GitFlix Episodes
      from = gitflix_episodes
      description = "Info on GitFlix Episodes"
    }
    gitflix_stats_per_user {
      label = GitFlix Users
      from = gitflix_users
      description = "GitFlix Stats Per User, Episode and Stream"
      joins {
        gitflix_streams {
          label = GitFlix Streams
          sql_on = "gitflix_streams.user_id = gitflix_stats_per_user.user_id"
          relationship = many_to_one
        }
        gitflix_episodes {
          label = GitFlix Episodes
          sql_on = "gitflix_episodes.episode_id = gitflix_streams.episode_id"
          relationship = many_to_one
        }
      }
    }
  }
}
Interact with Your Data in The Web App
With the previous step done, you are set to explore your data using Meltano UI and generate ad-hoc reports.
Go back to your Meltano instance and click on the Model option on the header of the page. This should bring us to the "Analyze: Models" page:
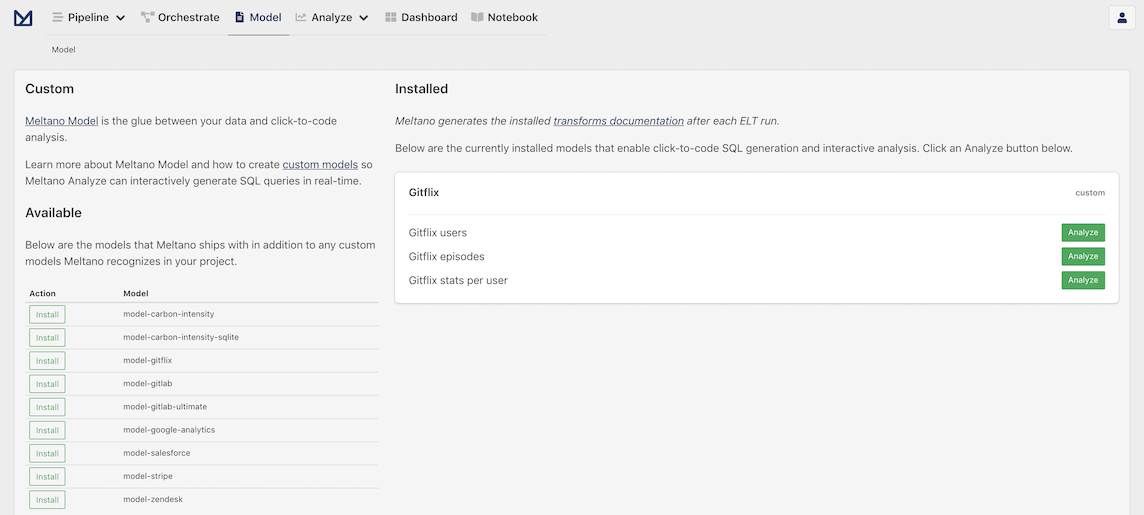
Meltano Models provide a starting point to explore and analyze data for specific use cases. They are similar to templates with only what is relevant for each use case included. As you can see in the right column, the models we created for Gitflix are already there.
Let's move on to the next step by clicking Analyze in the Gitflix stats per user card to move on to the next step.
Analyze the data
The Analyze page contains an interactive user interface to allow you to dynamically build queries and visualize your data.
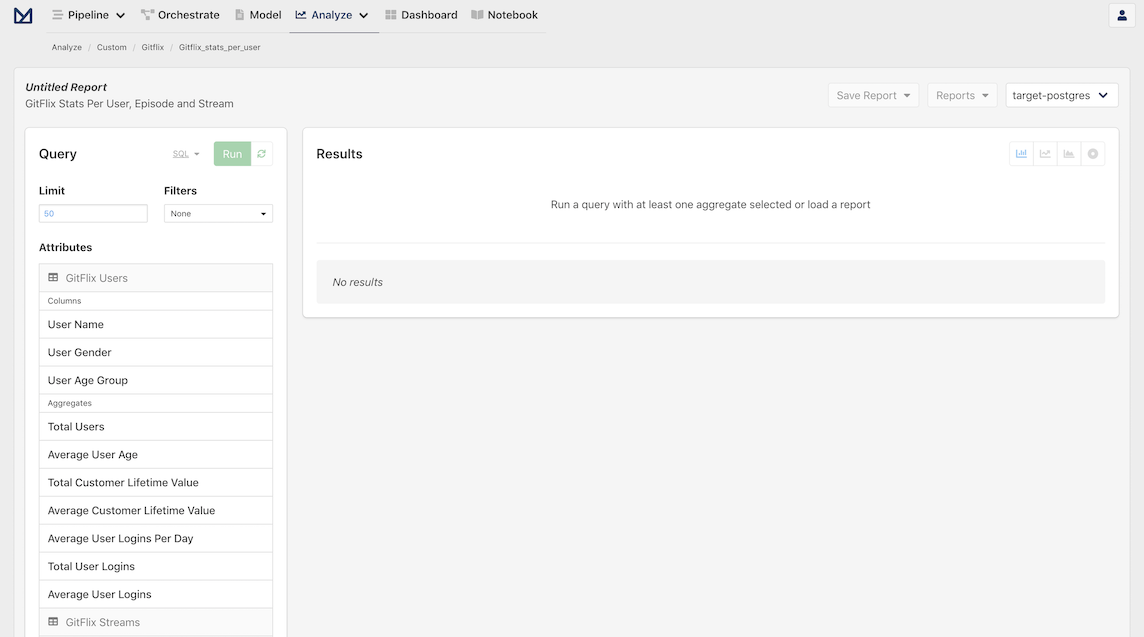
Now, let's explore and analyze our CSV data by selecting the following attributes in the left column:
- GitFlix Users
- User Gender
- Average User Age
- Average Customer Lifetime Value
- GitFlix Streams
- Total Streams
- Total Minutes Streamed
- Average Minutes Streamed
- GitFlix Episodes
- TV Series
- Average IMDB Rating
- Average Ad Revenue per Minute
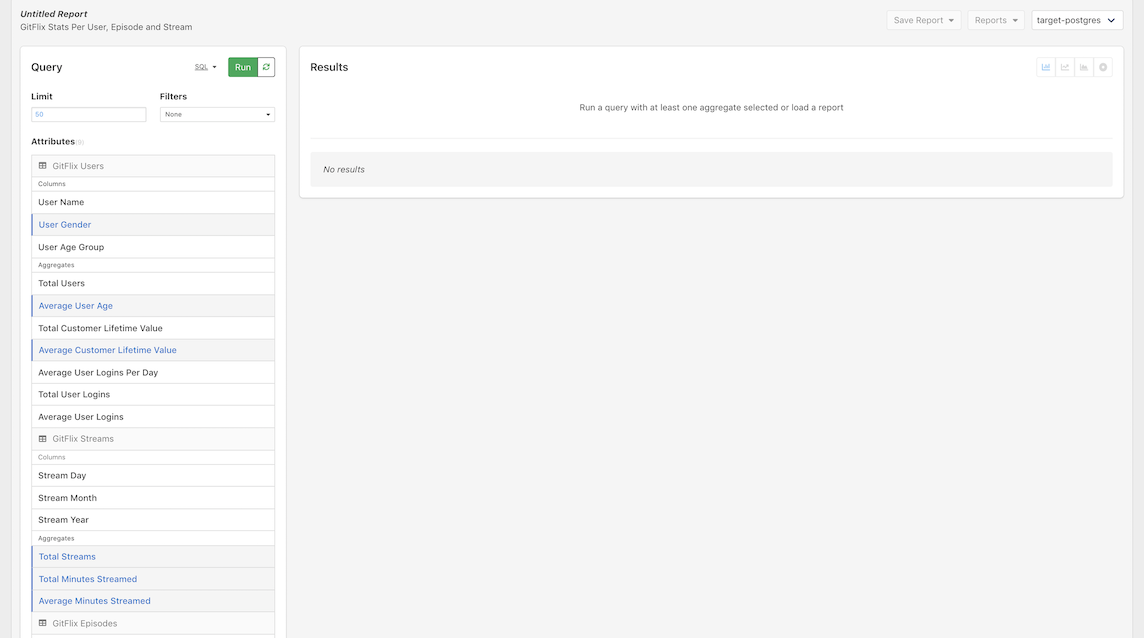
And with that, the big moment is upon us, it's time to click Run to run our query!
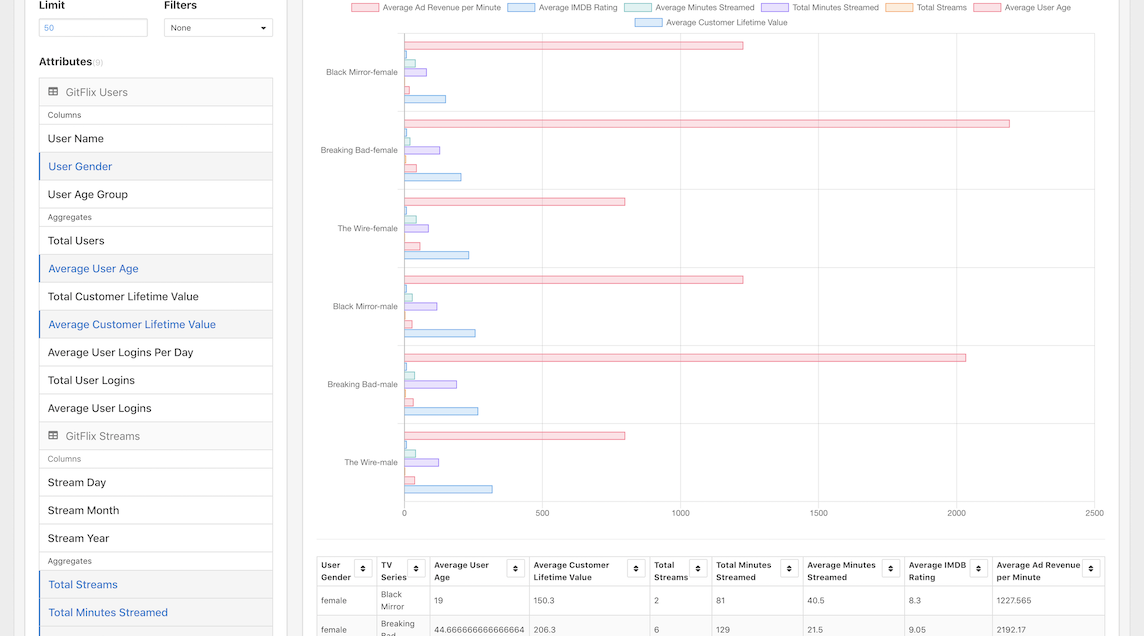
You should now see a beautiful data visualization and a table below to see the data in detail!
Let's order the data by Total Minutes Streamed descending:
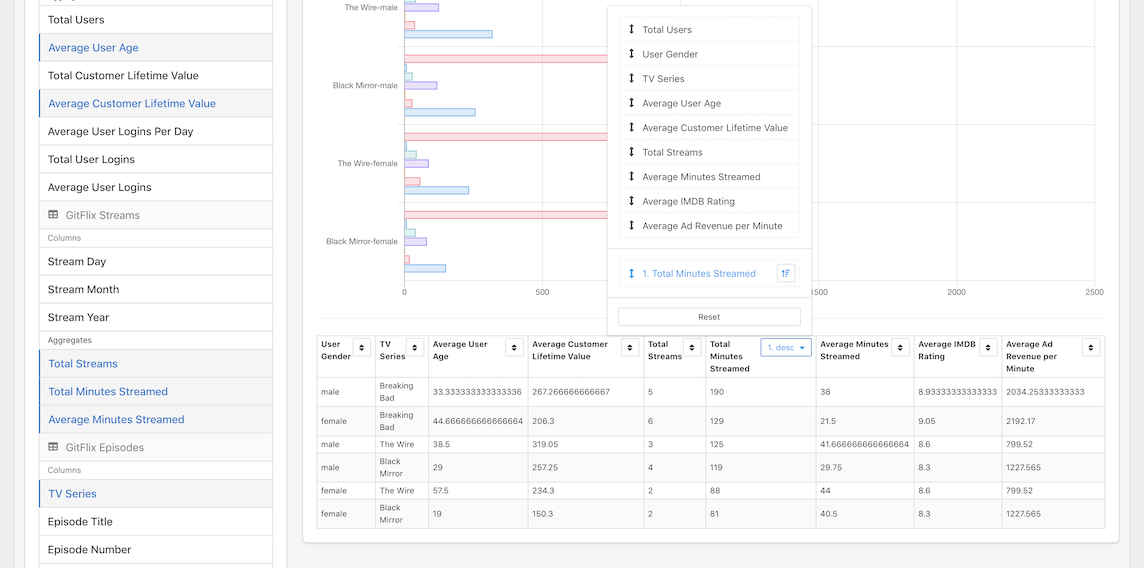
From that Table we can see that the most streamed TV show in GitFlix is "Breaking Bad". Also, it's clear that while the most valuable user segment based on their CLV are men watching "The Wire", the average ad revenue for that segment is pretty low.
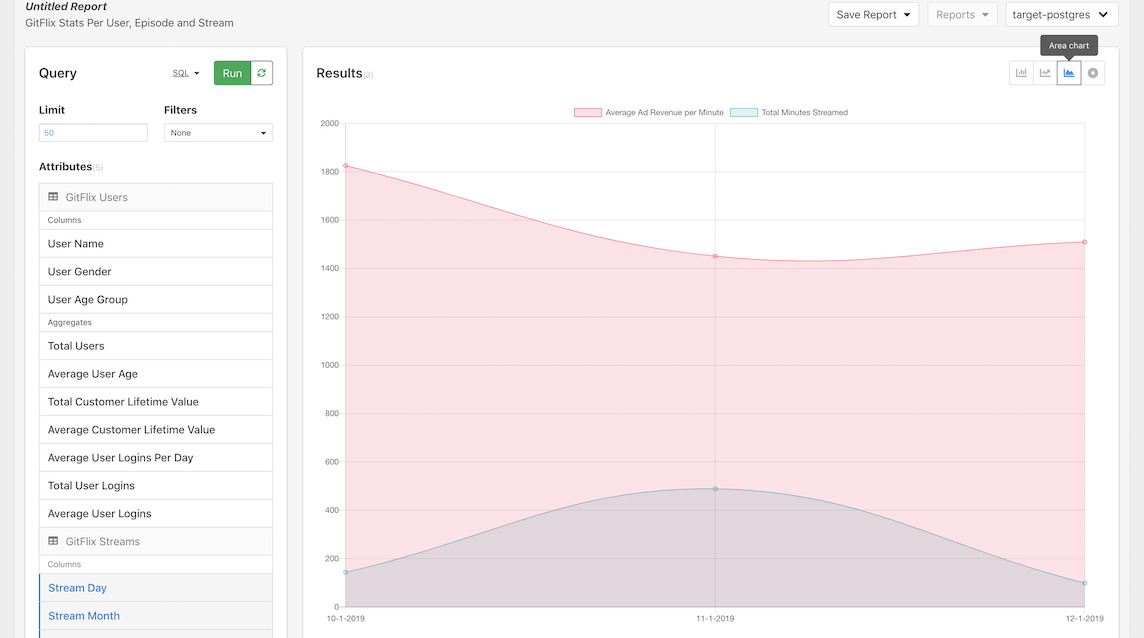
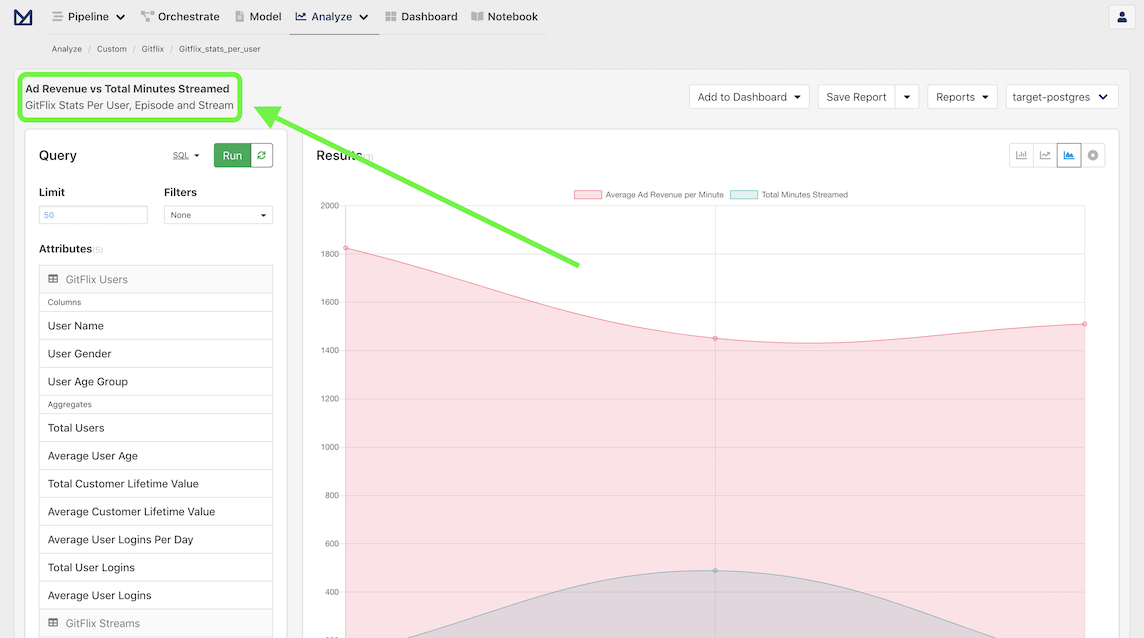
Finally, lets remove all the selected attributes and then select the Stream Day, Month and Year and the Total Minutes Streamed and Average Ad Revenue per Minute. Click Run and switch the graph to an area chart to check an interesting correlation in our data set:
Save a report
When we find an analysis that we want to reference in the future, we can easily do this by creating a report. This can be accomplished by clicking on the Save Report dropdown in the Analyze toolbar. This will open a dropdown with a default report name that is dynamically populated, but can be easily changed.
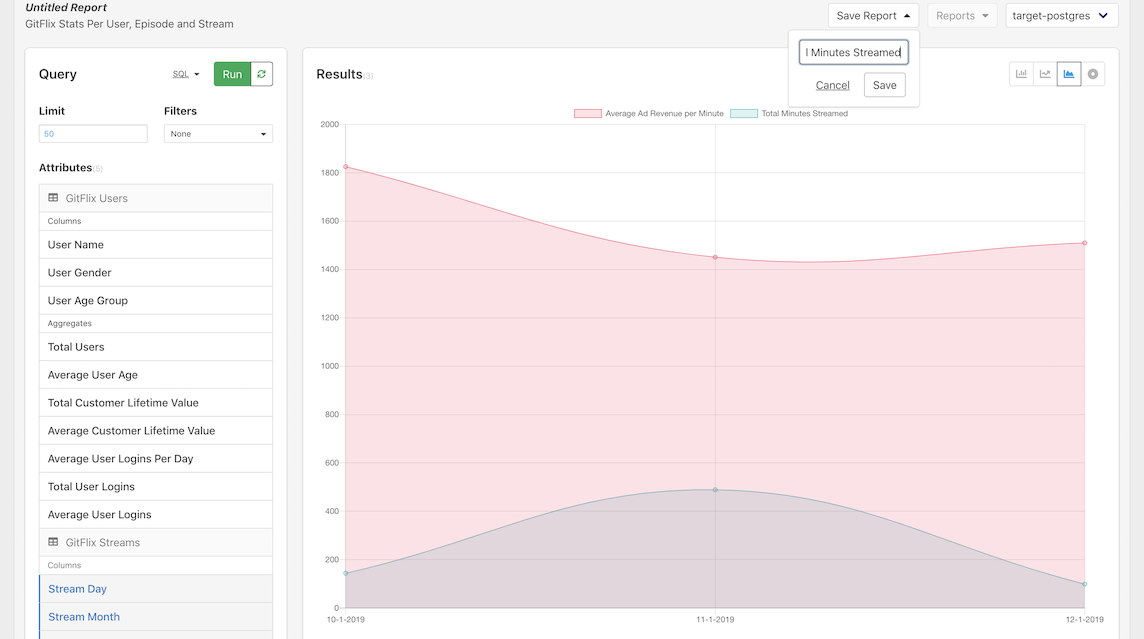
Once we click Save, we should see the upper left "Untitled Report" change to our new report name.
And with that, our analysis has been saved!
Add a report to a dashboard
As you acquire more reports, you will probably want to organize them via dashboards. This can be done by clicking on the new Add to Dashboard dropdown in the toolbar.
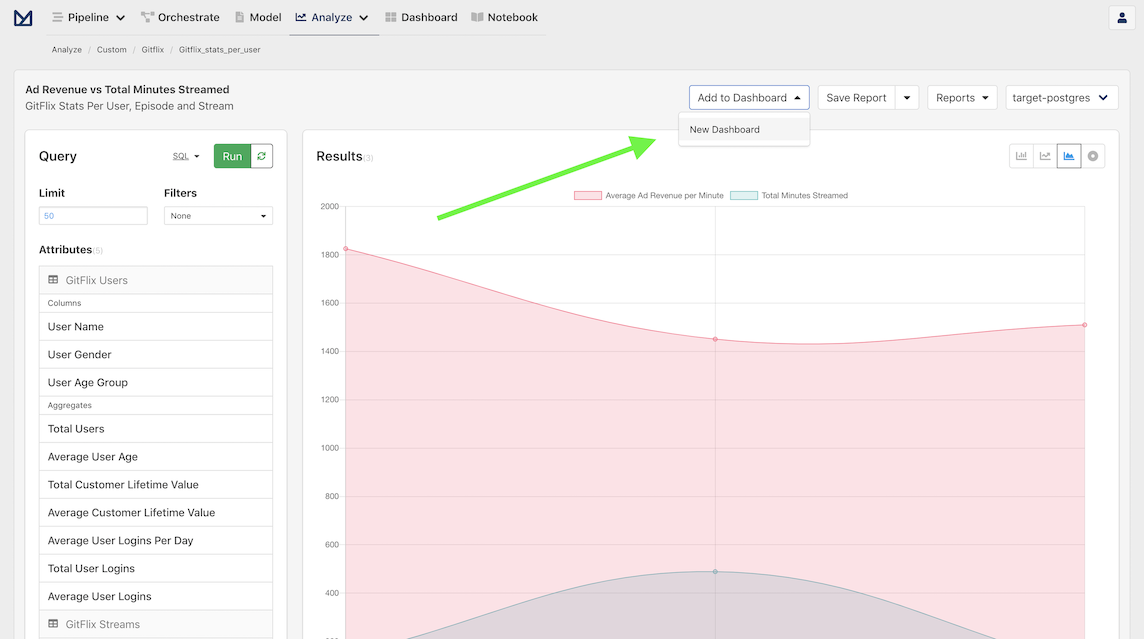
Since we have never created a dashboard, click on New Dashboard, which will trigger a modal that contains a dynamically generated dashboard name that can be customized as desired.
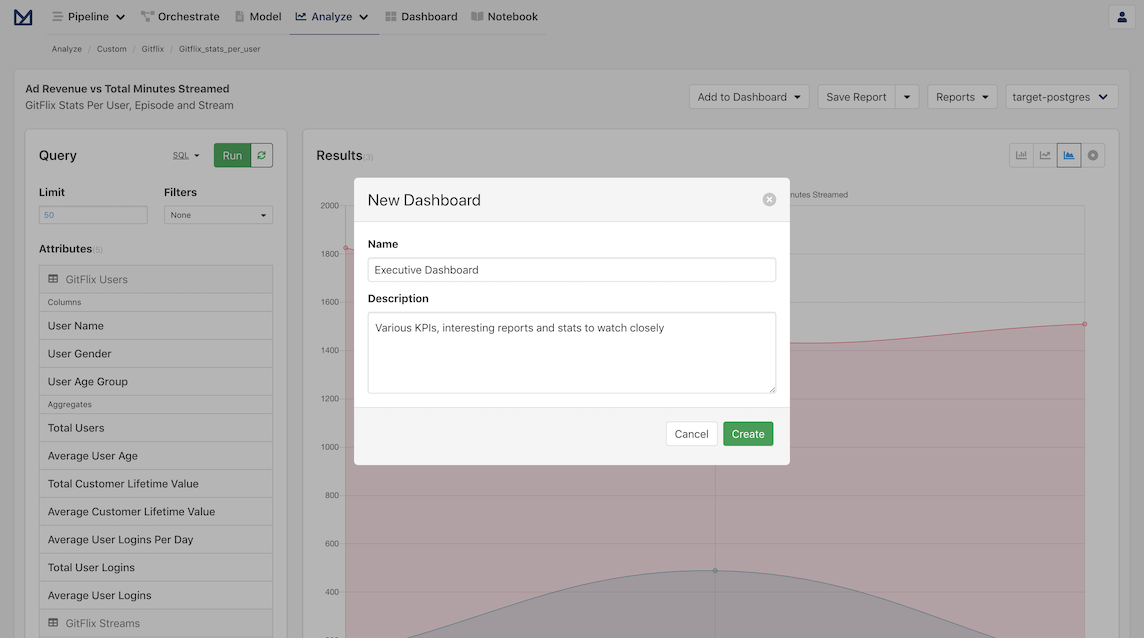
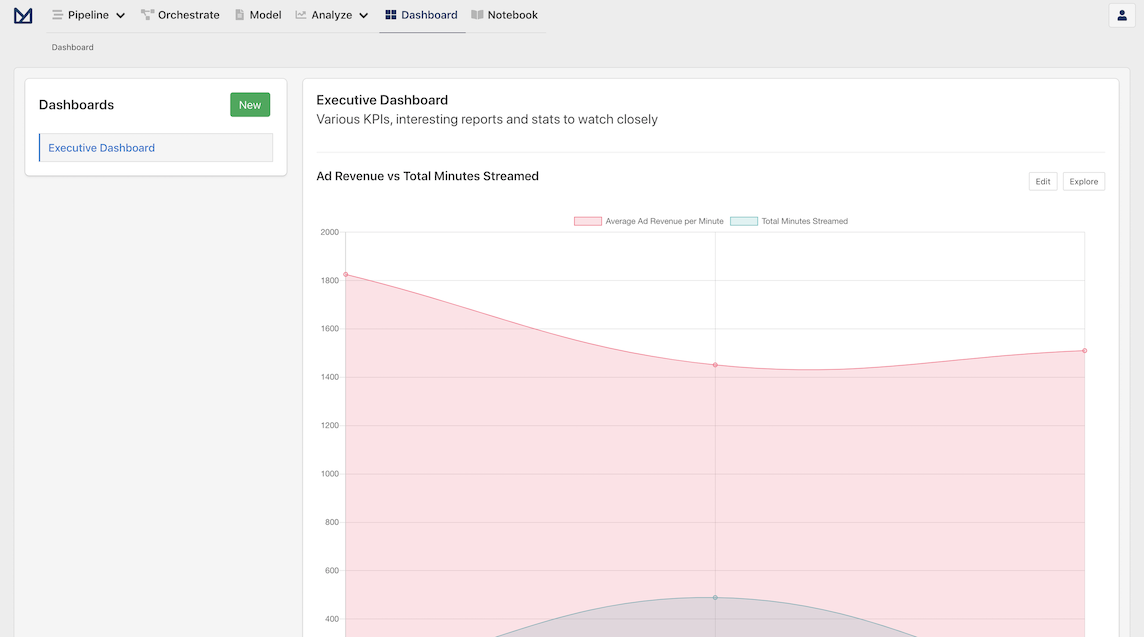
Once we click Create, we can now verify that the our report has been added to the Dashboard by clicking on the Add to Dashboard menu. We can also visit the Dashboard directly by clicking on the Dashboard navigation item in the header, which shows our newly created Dashboard and the associated Report.
Next steps
You should now be able to follow the same steps to import your own CSV files and generate complex reports in Meltano UI:
Prepare your CSV files so that they have a header in the first line with the attribute names.
Update
files-def.jsonto link your CSV files and use the proper entity name and key(s) for each.Import and check the raw data
Add custom Transforms and Models by following the Gitflix example or any other Transforms and Models provided by Meltano. You can check the Meltano Group for projects that define default transforms or models for various supported APIs if you want to check real world examples.