Tutorial: GitLab API + Postgres
In this tutorial we'll explain how to get the GitLab Extractor integrated with your Meltano project to pull your GitLab data and load it into a Postgres analytics database.
Prerequisites
For this tutorial, you can use a new or existing Meltano project.
If you need help getting started, we recommend reviewing the Installation documentation and Getting Started Guide to set up your first project.
If this is your first time using GitLab with Meltano, you will need to enable access to GitLab's API and get your GitLab Private Token by following the instructions found in the GitLab Extractor documentation.
Setup the GitLab Extractor
Open your Meltano instance and click "Pipelines" in the top navigation bar. You should now see the Extractors page, which contains various options for connecting your data sources.
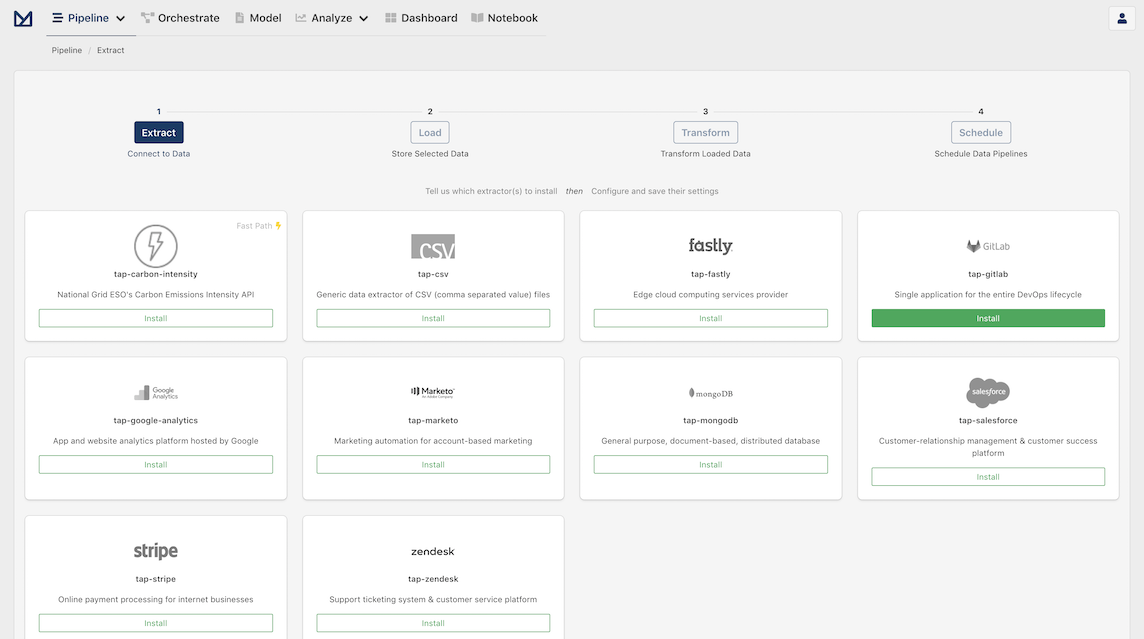
Let's install tap-gitlab by clicking on the Install button inside its card.
On the configuration modal we want to enter the Private Token that GitLab extractor will use to connect to GitLab, the Groups and Projects we are going to extract from and the Start Date we want the extracted data set to start from.
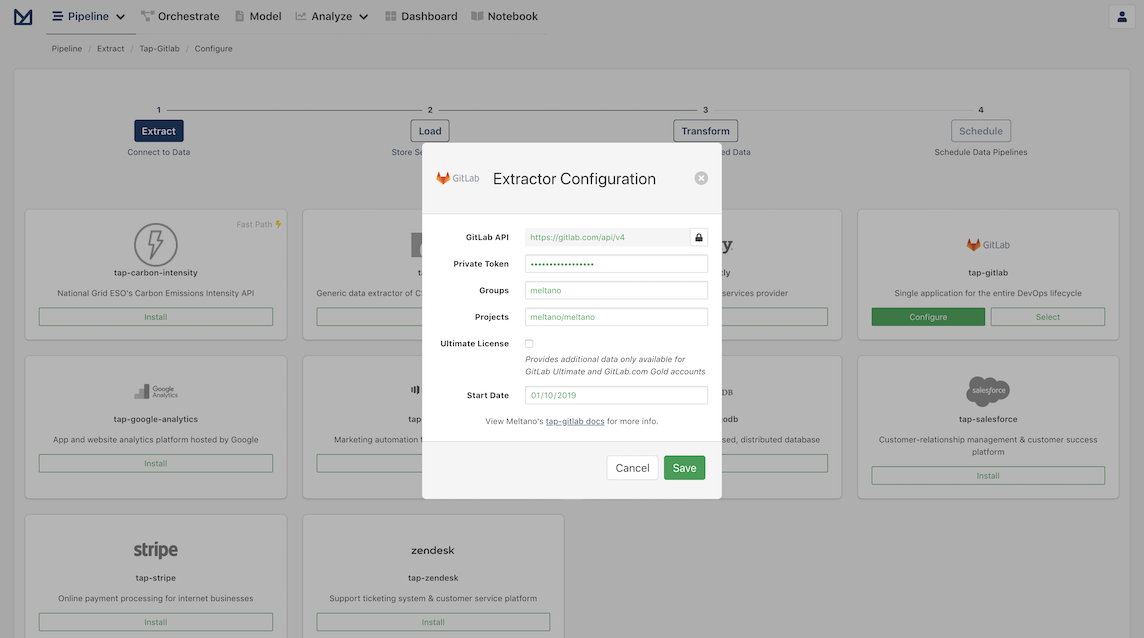
For this tutorial, we will scope our data sample to only include the Meltano project to make things faster.
- Populate
Groupswith the Meltano group:meltano - Populate
Projectswith the Meltano project:meltano/meltano - Set the
Start Dateto the beginning of last month, for example:01/10/2019
Setup the Postgres Loader
Click Save to finish configuring the extractor and progress to the next step, the Loaders page.
Click to Install Postgres and set the credentials for your local Postgres.
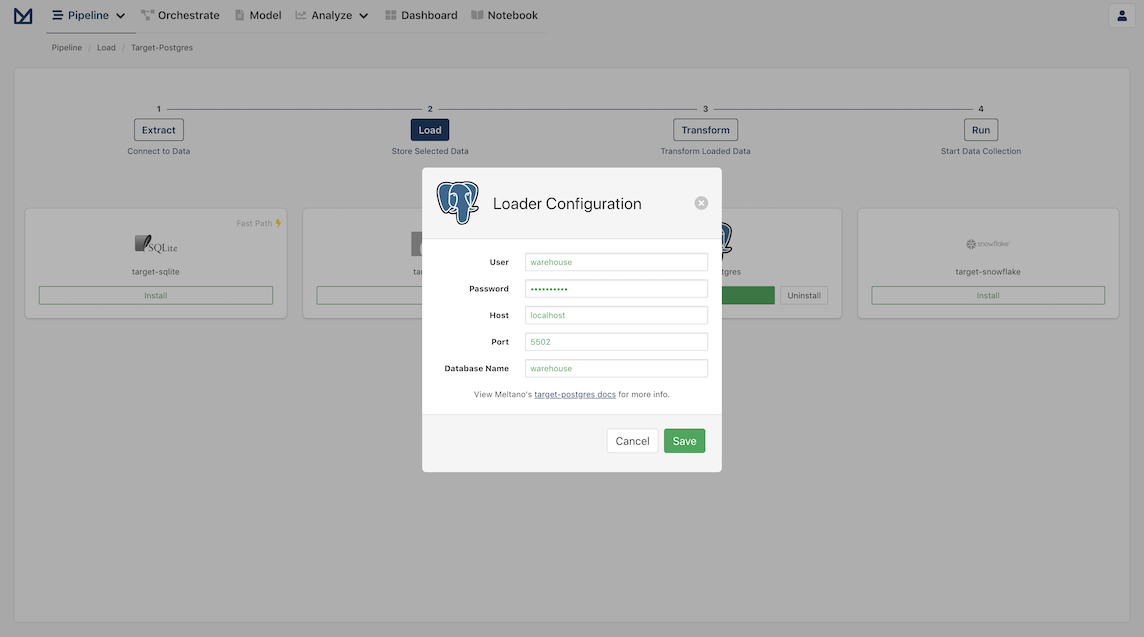
Information on how to install a Postgres Database on your local machine and configure the Postgres Loader can be found on PostgresQL Database Tutorials.
Apply transformations as desired
With our extractor and loader configured, you should now see the following page:
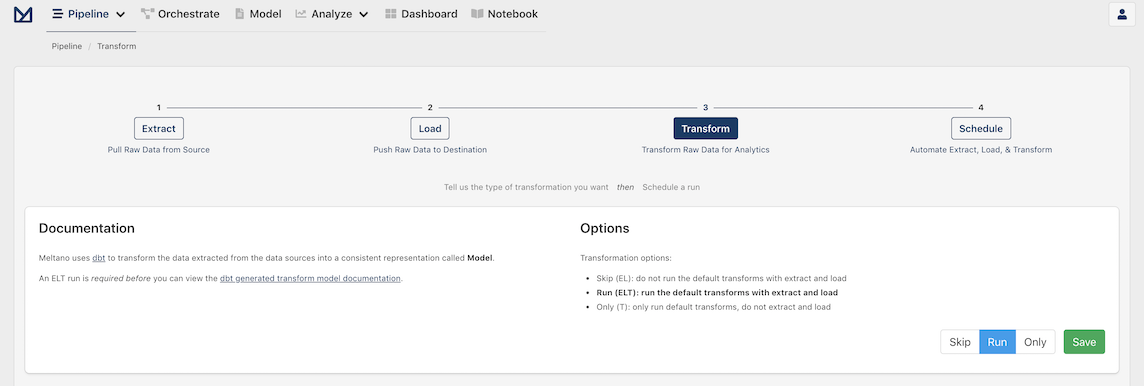
This page allows you to apply transformations to your data. We want to run the default transforms that come pre-bundled with Meltano for data fetched from GitLab, so we are going to select Run and then click Save.
If you'd like to learn more about how transforms work in Meltano, check out our docs on Meltano transform.
Create a pipeline schedule
You should now be greeted with the Schedules page with a modal to create your first pipeline!
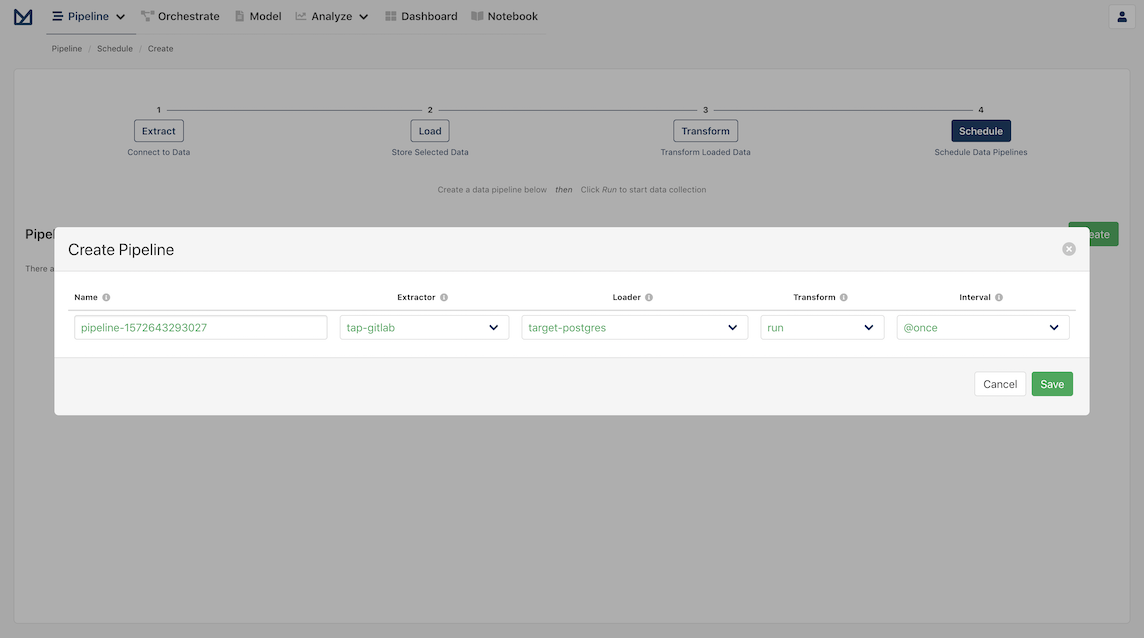
Pipelines allow you to create scheduled tasks through Apache Airflow. For example, you may want a recurring task that updates the database at the end of every business day.
In the current form, you will see:
- A pipeline name which has a default name that is dynamically generated, but can be easily changed if desired
- The extractor the pipeline will use, which should be
tap-gitlab - The loader the pipeline will use, which should be
target-postgres - Whether the transform step should be applied, which should be
run - The interval at which the pipeline should be run, which is set by default to be
@once
All we need to do is click Save to start our new pipeline! The pipeline's log opens automatically and you can check the pipeline running and what Meltano does behind the scenes to extract and load the data.
You should see a spinning icon that indicates that the pipeline is not completed. Once it's complete, the indicator will disappear and you should be able to see the final results of the extraction:
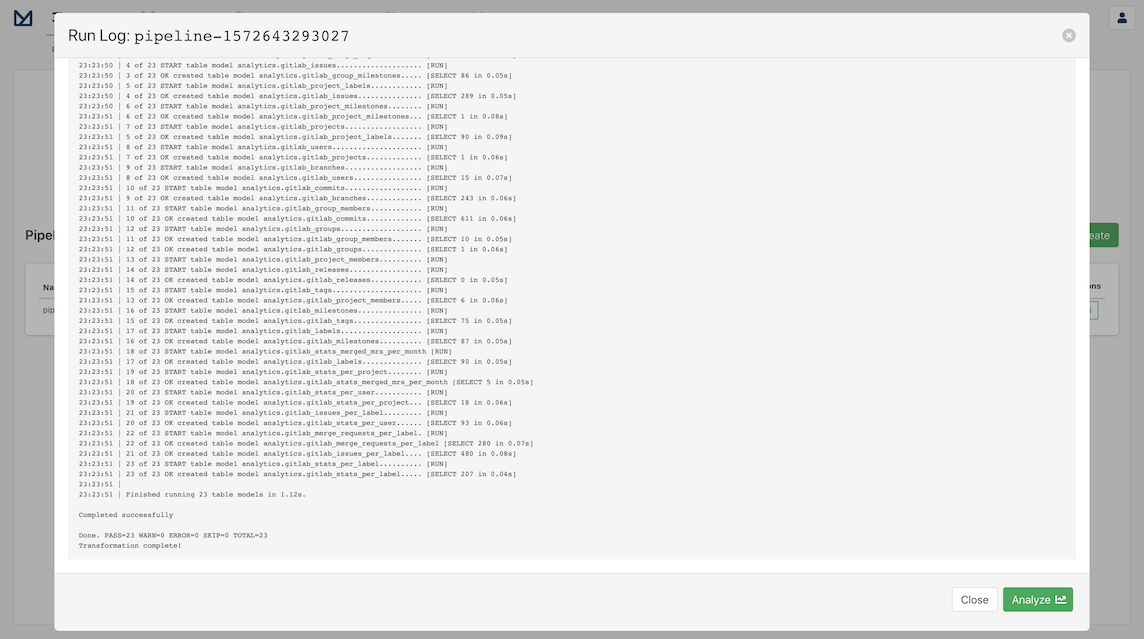
Congratulations! Now that you have connected to GitLab, configured the Postgres Loader, and run a successful pipeline for the dataset, we are now ready to analyze the data!
Select a data model
Let's start by closing the Run Log for the pipeline and click on the Model option on the header of the page. This should bring us to the "Analyze: Models" page:
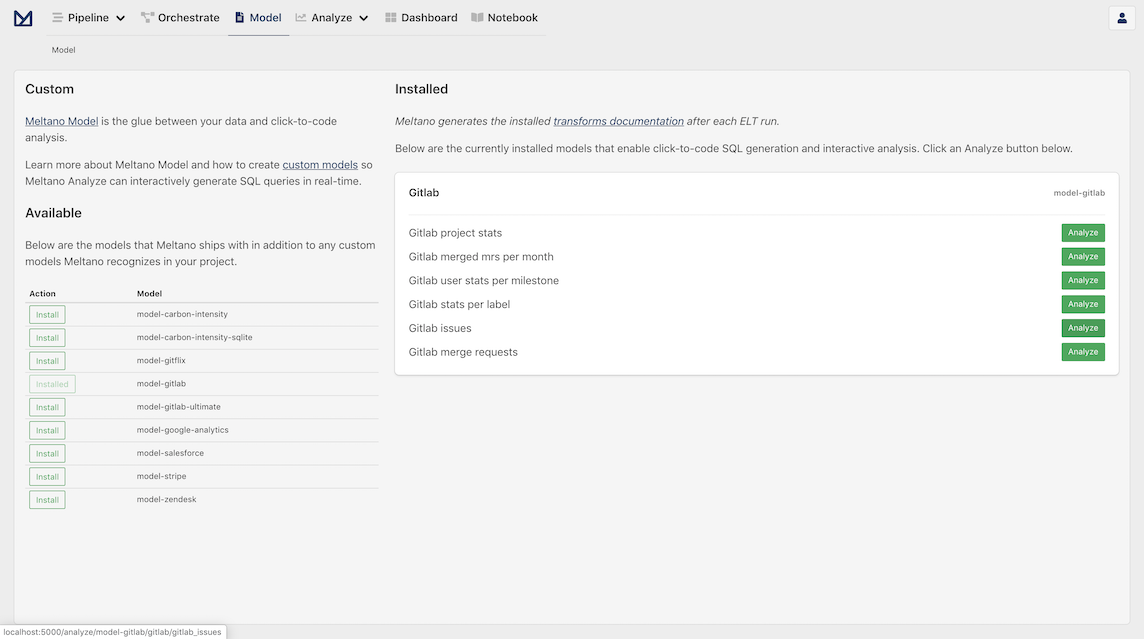
Meltano Models provide a starting point to explore and analyze data for specific use cases. They are similar to templates with only what is relevant for each use case included. As you can see in the right column, Gitlab already has the required models installed.
Let's move on to the next step by clicking Analyze in the Gitlab Issues card to move on to the next step.
Analyze the data
The Analyze page contains an interactive user interface to allow you to dynamically build queries and visualize your data.
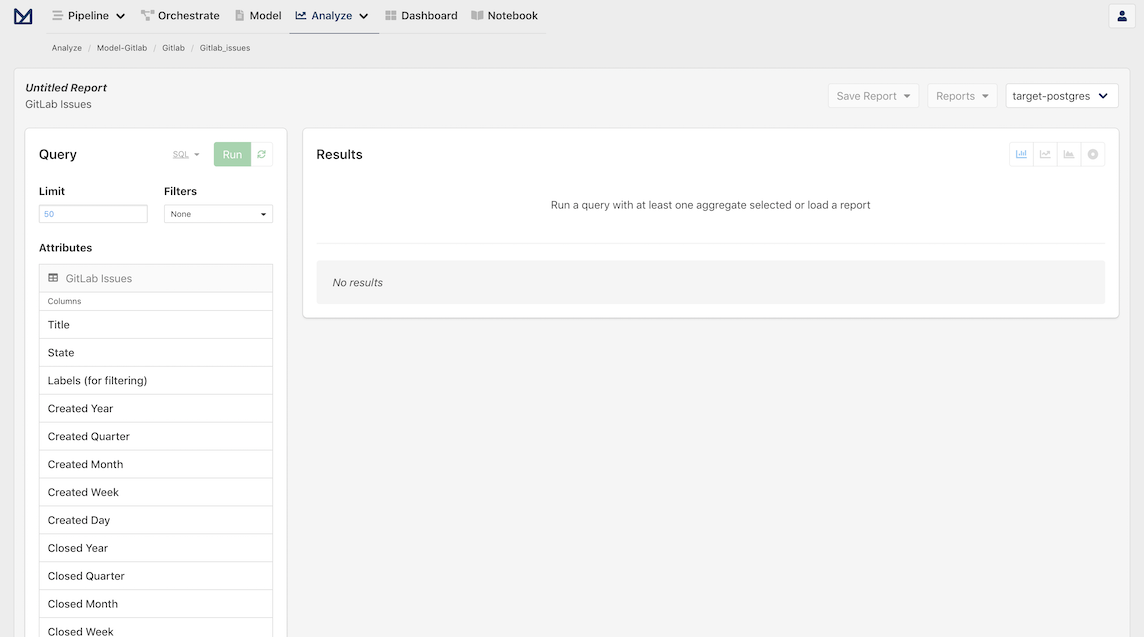
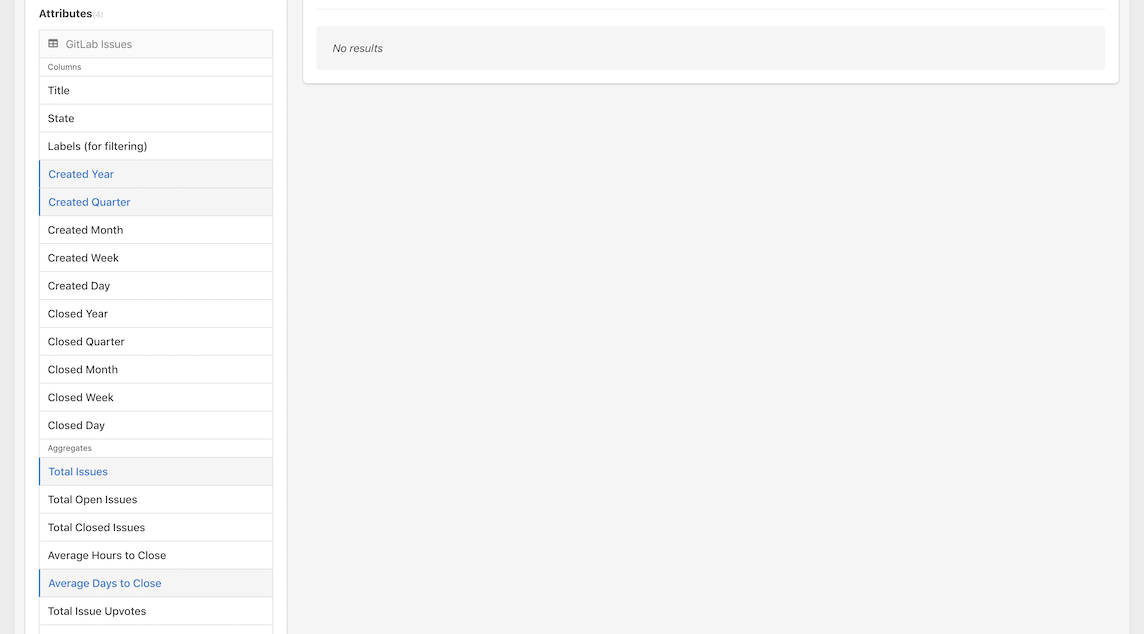
Now, let's explore and analyze our GitLab Issues data by selecting the following attributes in the left column:
- Columns
- Created Year
- Created Quarter
- Aggregates
- Total Issues
- Average Days to Close
And with that, the big moment is upon us, it's time to click Run to run our query!
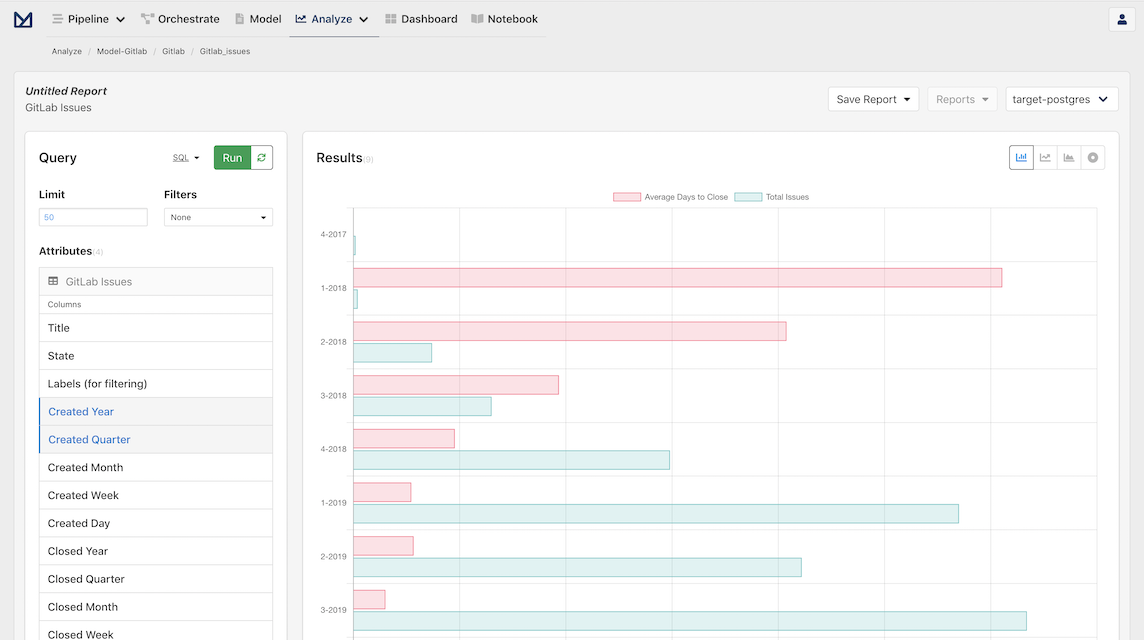
You should now see a bar chart visualization and a table below to see the data in detail!
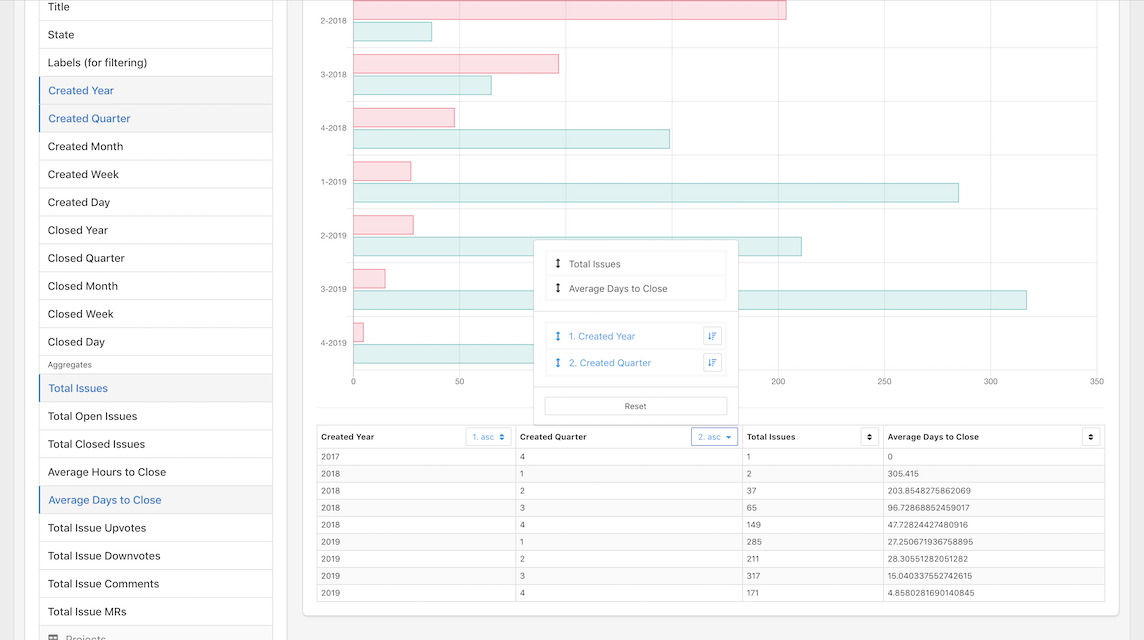
Let's order the data by Year and Quarter ascending:
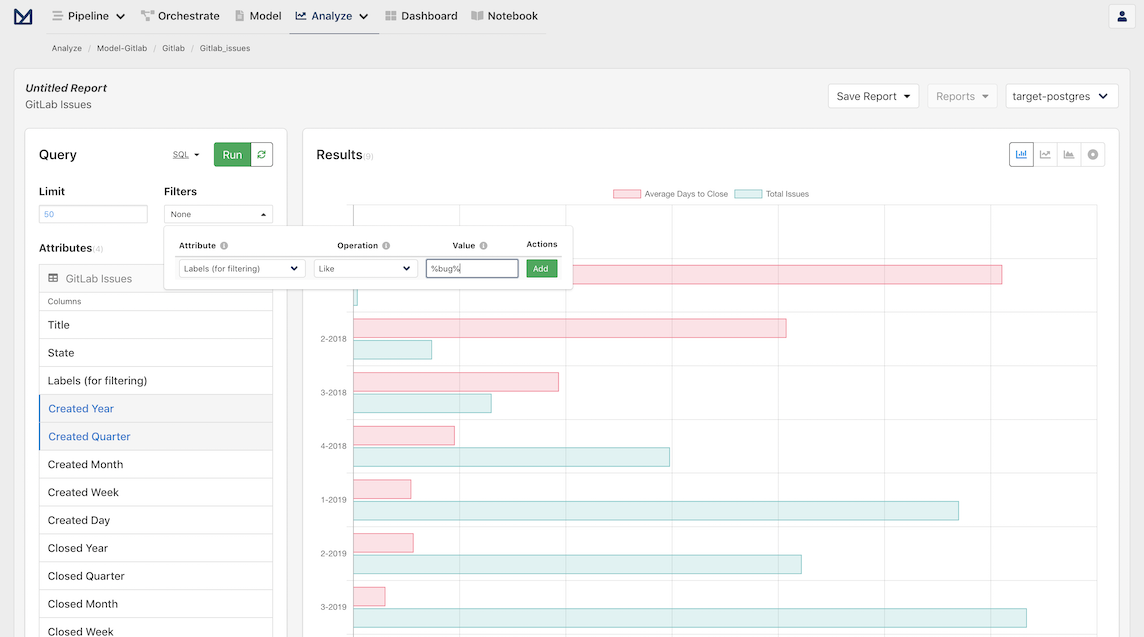
We can also filter the results to only include bugs. Select the Filters dropdown menu at the top of the Query pane and add a filter to only keep issues with the bug label:
Labels (for filtering) --> Like --> %bug%
We add the percentages around the bug cause issues may have multiple labels and the bug label can be anywhere in that field.
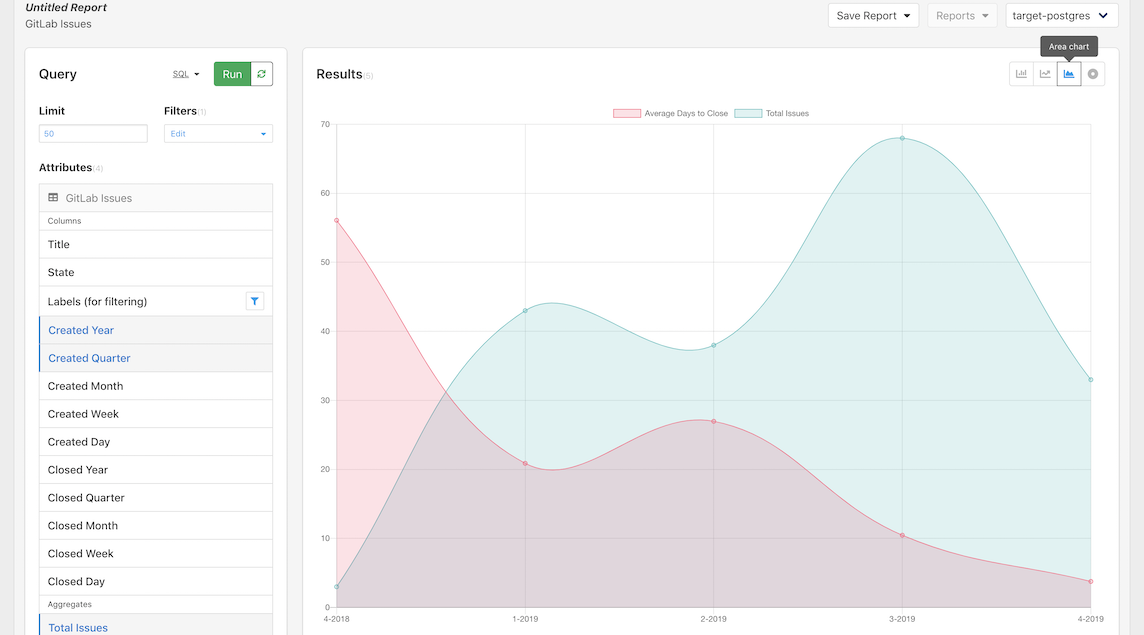
And, finally, switch the graph to an area chart:
Save a report
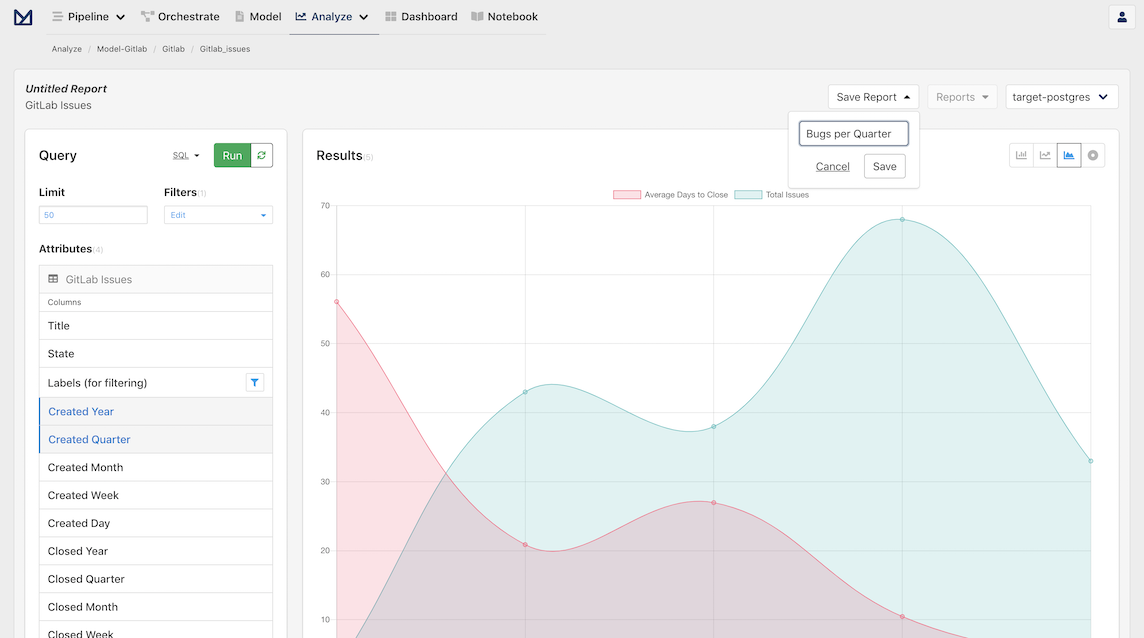
When we find an analysis that we want to reference in the future, we can easily do this by creating a report. This can be accomplished by clicking on the Save Report dropdown in the Analyze toolbar. This will open a dropdown with a default report name that is dynamically populated, but can be easily changed.
Once we click Save, we should see the upper left "Untitled Report" change to our new report name.
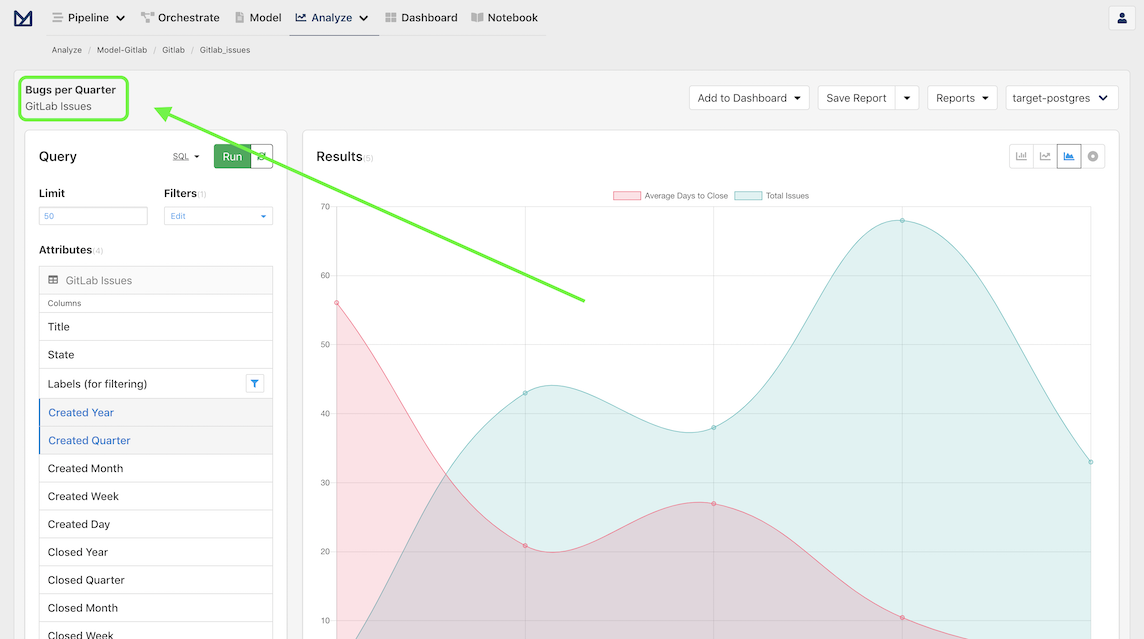
And with that, our analysis has been saved!
Add a report to a dashboard
As you acquire more reports, you will probably want to organize them via dashboards. This can be done by clicking on the new Add to Dashboard dropdown in the toolbar.
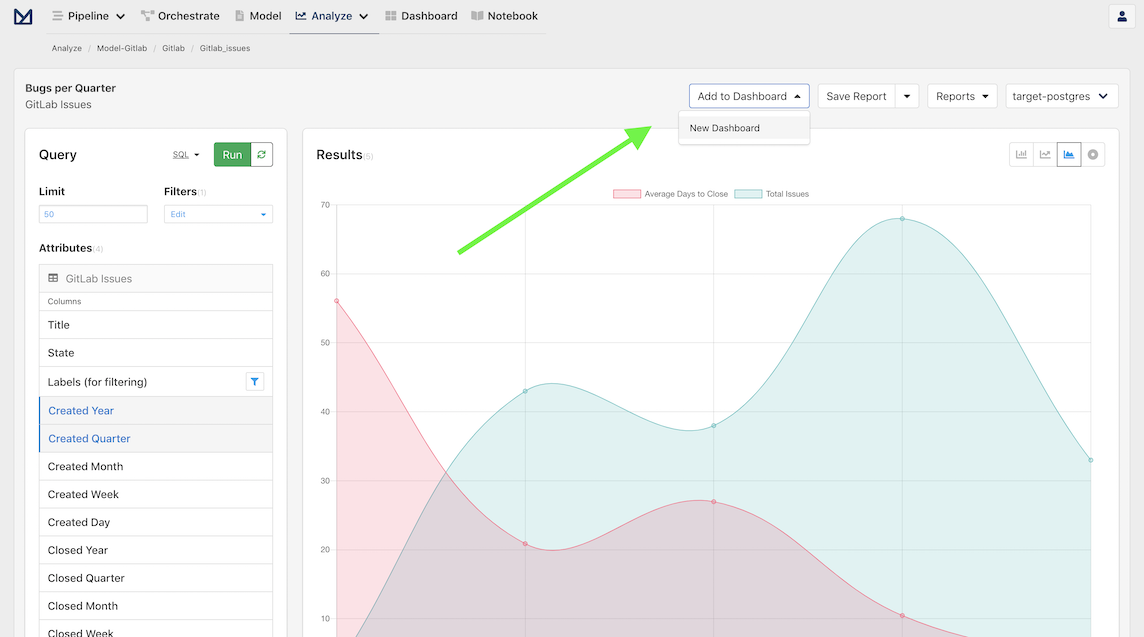
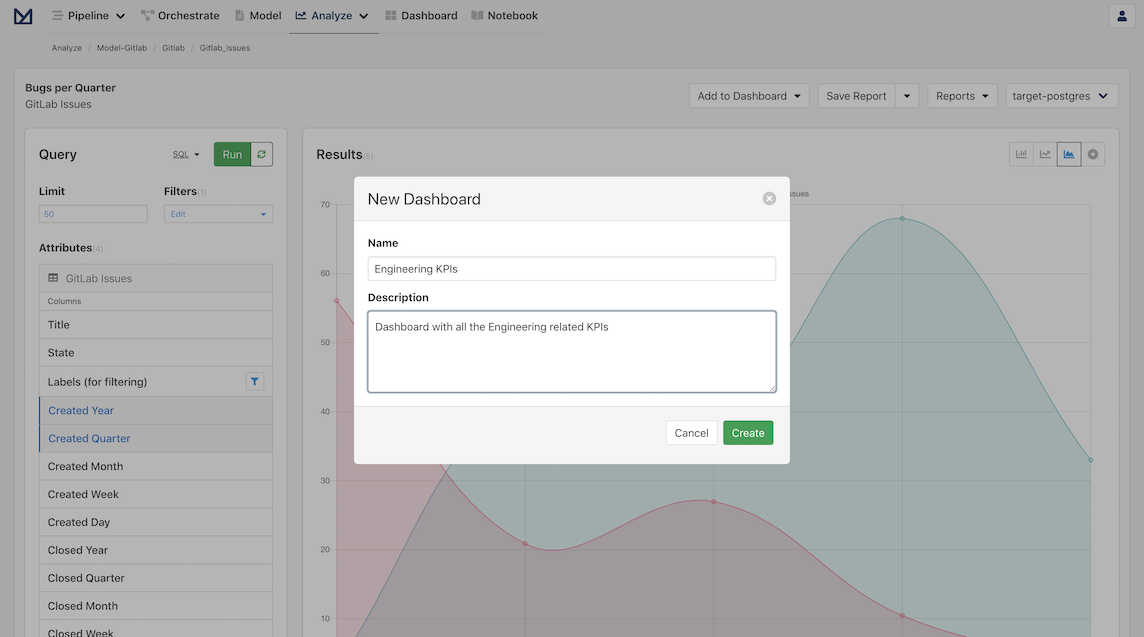
Since we have never created a dashboard, click on New Dashboard, which will trigger a modal that contains a dynamically generated dashboard name that can be customized as desired.
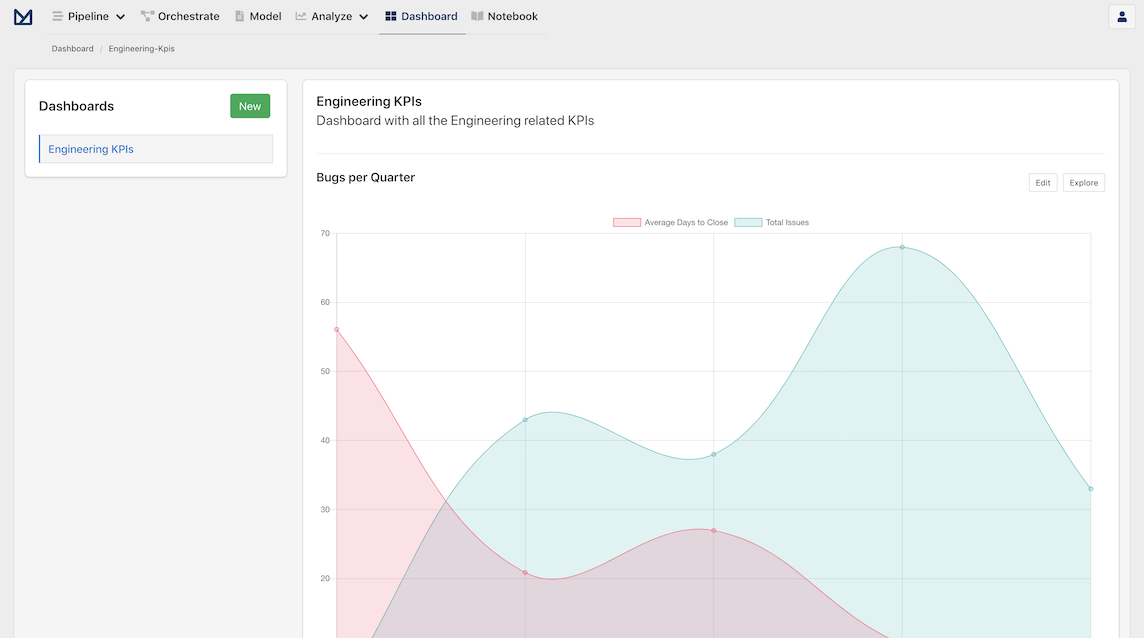
Once we click Create, we can now verify that the our report has been added to the Dashboard by clicking on the Add to Dashboard menu. We can also visit the Dashboard directly by clicking on the Dashboard navigation item in the header, which shows our newly created Dashboard and the associated Report.
Next steps
And with that, you have now setup a complete end-to-end data solution for extracting and analyzing GitLab data with Meltano! 🎉
You can now check the rest of the pre-bundled Models for Projects, Merge Requests, Users and more.
Don't forget to save the reports that you find useful and add reports to your dashboards.